Surface Water Viewer User Guide
Note: This Guide Under revision
MAP WINDOW
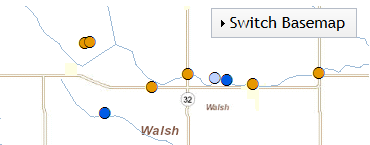
Allows a user to select a backdrop layer for the Viewer. To use, click on the Switch Basemap button on the upper right corner of the map and click on a basemap option. Choose whichever basemap you want. To close the basemap window, click on the Switch Basemap button again.
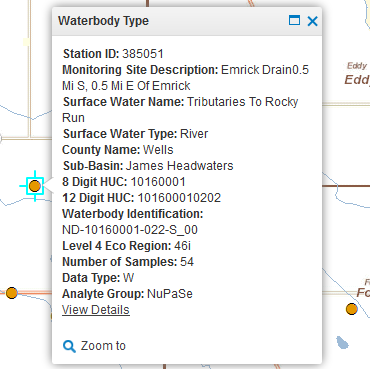
The identify tools give the user the ability to click on a water station point and receive information. To use this functionality, simply click on any water station point and information about that point(water station)will "pop-up" for display. The user can also get additional information on a station of interest by clicking on the "View Details" link in the popup window.
SEARCH STATIONS
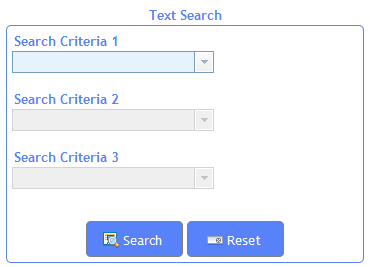
Text search gives the user the ability to define their search using up to their 3 different criteria. If you only want to use 1 criteria, select or enter a value for "search criteria 1" and hit search. If you want to refine your search, select or enter a value for "Search Criteria 1" and "Search Criteria 2" and then hit search. To refien the search even further, select or enter a value for "Search Criteria 1" and "Search Criteria 2" and "Search Criteria 3" and then hit search. The results will be displayed in the "SELECTED STATIONS" pane. Each selection criteria must be from a different field EXCEPT for ANALYTEGRP for which you can use for more than 1 criteria. Clicking the Reset button will allow a user to clear the search criteria and start a new search.
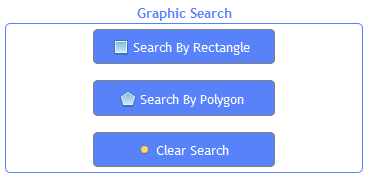
Graphic search gives the user the ability to use shape tools to select desired water stations points. To search by rectangle, click on "search by rectangle" button and then move cursor to the map. Click and hold, draw a box, and the release to select desired points. To search by Polygon, click on "Search by Polygon" and then move cursor to map. To create a polygon arround the desired water station points, click once to create your first point, then move the cursor and click again. The points will be connect by a line. Continue to do this until your last point at which you double click to complete the polygon and select all water station points within it. To clear your search and the temporary yellow points showing your selection, simply click on the clear search tool. Please see the video for a brief demonstration on how to use the Graphic Search Tools.
SELECTED STATIONS

Upon peforming a Text or Graphic Search, the selected station will show up in the "SELECTED STATIONS" pane. to expand a station click on the "+" symbol. To collapse a station, click on the "-"symbol. To get more information on a particular water station, click on "VIEW DETAILS" in expanded view. To download data affiliated with a particular water station, check the box left of any station of interest and the click on the "Download all Data for Selected Stations" button. Please see the video for a brief demonstration on how to use the "SELECTED STATIONS" display.
MAP TOOLS

The map navigation tools to the left will provide you ways to move around the map. Below is a brief description of each tool:
Zoom In - Use this tool to get a more detailed view of the map. Click on the zoom in button and either click on the map or "box" an area on the map to zoom in.Zoom Out - Use this tool tool for a broader view of the map (less detail). Click on the zoom out button and either click on the map or "box" an area on the map to zoom out.
Pan - Use this tool to move around the map at the current zoom level
Previous Extent - click on this button to take the map back to the previous location
Next Extent - Click on this button to take the map to the location from which you just navigated
Full Extent - Click on this button to take the map to the original view
MAP LAYERS
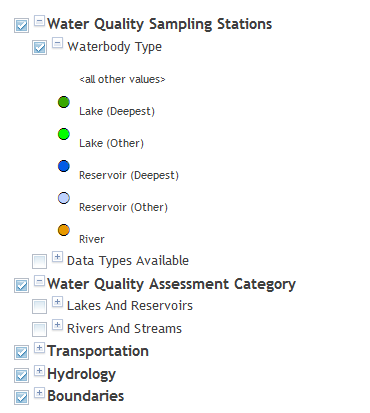
The map layer listings to your left gives the user the ability to toggle on and off the visibility of layers. However some layers are set to display at a certain zoom level so even though the box is checked the layer will not become visible until the map is zoomed to that zoom level. There is also a legend tied to each layer so a user can make sense of the points, lines, and polygons they see on the map.
DETAILS PAGE
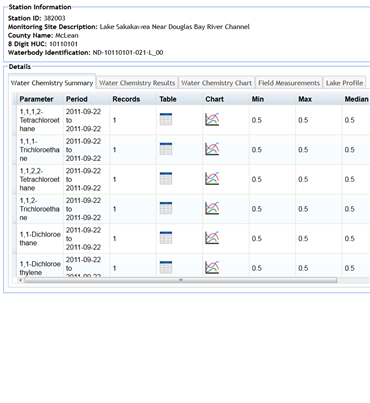
The detail page opens with the Station Information displayed at the top of the page. The Data Type field indicates the types of data that are available for this station and the Analyte Group indicates the types of parameters that were analyzed at this station.
On the lower portion of the page, the Detail section includes multiple tabs that have sample data information displayed in various ways. If the station has Water Chemistry Data, the first tab will display the Water Chemistry Summary. This is a list of all of the parameters at this station and statistics including the number or samples or records for each parameter, as well as the Min, Max, Median, Mean, Standard Deviation and the Percent of results in each quartile. If you click on a specific parameter row in the Water Chemistry Summary tab the row will become highlighted in light blue and the next two tabs will be populated with data specific to that parameter. Once a parameter is selected, when you click on the second tab labeled Water Chemistry Results, it will display all of the sample results for that parameter. For example if you click on the parameter “Ammonia (N)” under the Water Chemistry Summarytab and then click on the second tab named Water Chemistry Results, it will list all of the Ammonia (N) results for that station. Then if you click on the third tab labeled Water Chemistry Chart, it will display a chart with the Ammonia (N) results plotted on it. The fourth tab labeled Field Measurements displays the field measurements for the station. If there are no field measurements, this tab will be blank. The fifth tab Lake Profile displays data for the station. If there is no Lake Profile data, this tab will be blank.
On the top right hand side is a blue button that says “Download Data”. This button will download the data for the current tab. So if you are on the Water Chemistry Results tab, it will download the water chemistry results for the selected parameter for the current station in a CSV file. Note, if you are on the Water Chemistry Chart tab, it will not download any data and you will get an error that says “Invalid Operation”. If you want to get all of the water chemistry parameters in one download file, go back to the search page, do a search that includes the station(s) data you desire, and then select the station by checking the box in the Selected Stations window on the left side of the page. Finally, click the “Download All Data for Selected Stations” button.